Blog

A Markov Christmas chain
Let's generate colorful Christmas chains that fulfill the Markov property!
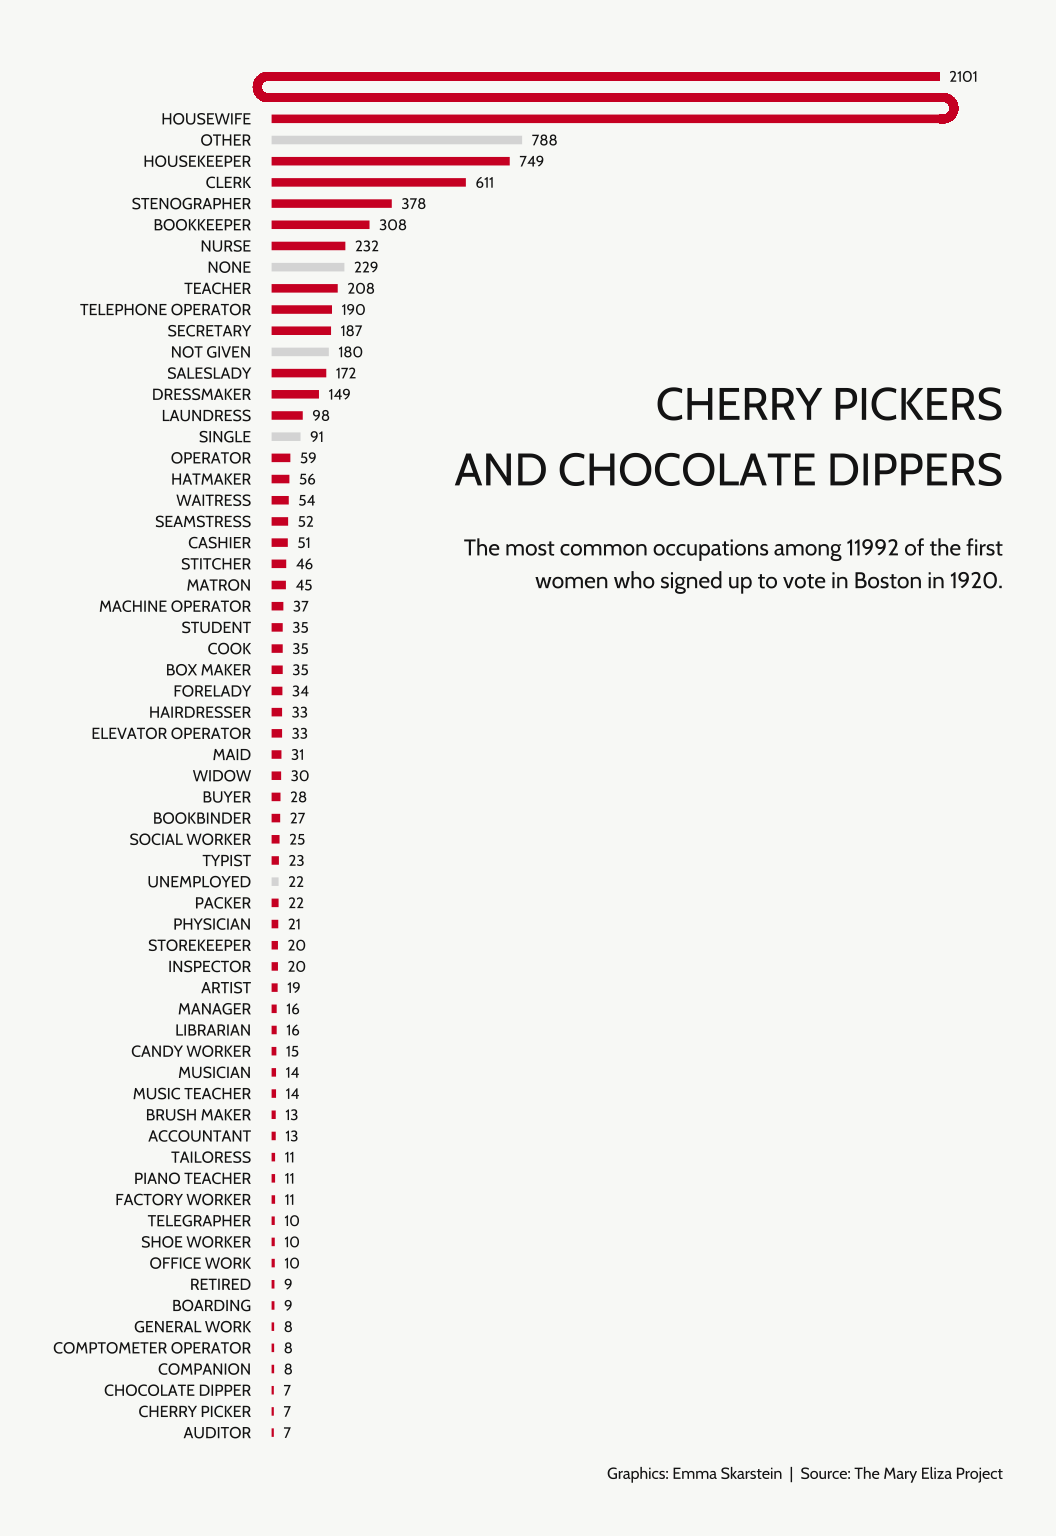
What did women work with in 1920?
In this post I'll be looking at the occupations of the 11992 women who registered to vote in Boston in 1920. Using `ggplot2` I'll be making a bar chart with a curved bar to display the different occupations.

Power consumption project
Through elhub.no I have access to all the power consumption data from my apartment. I have made the data available in an R package, and this is a brief look at it!
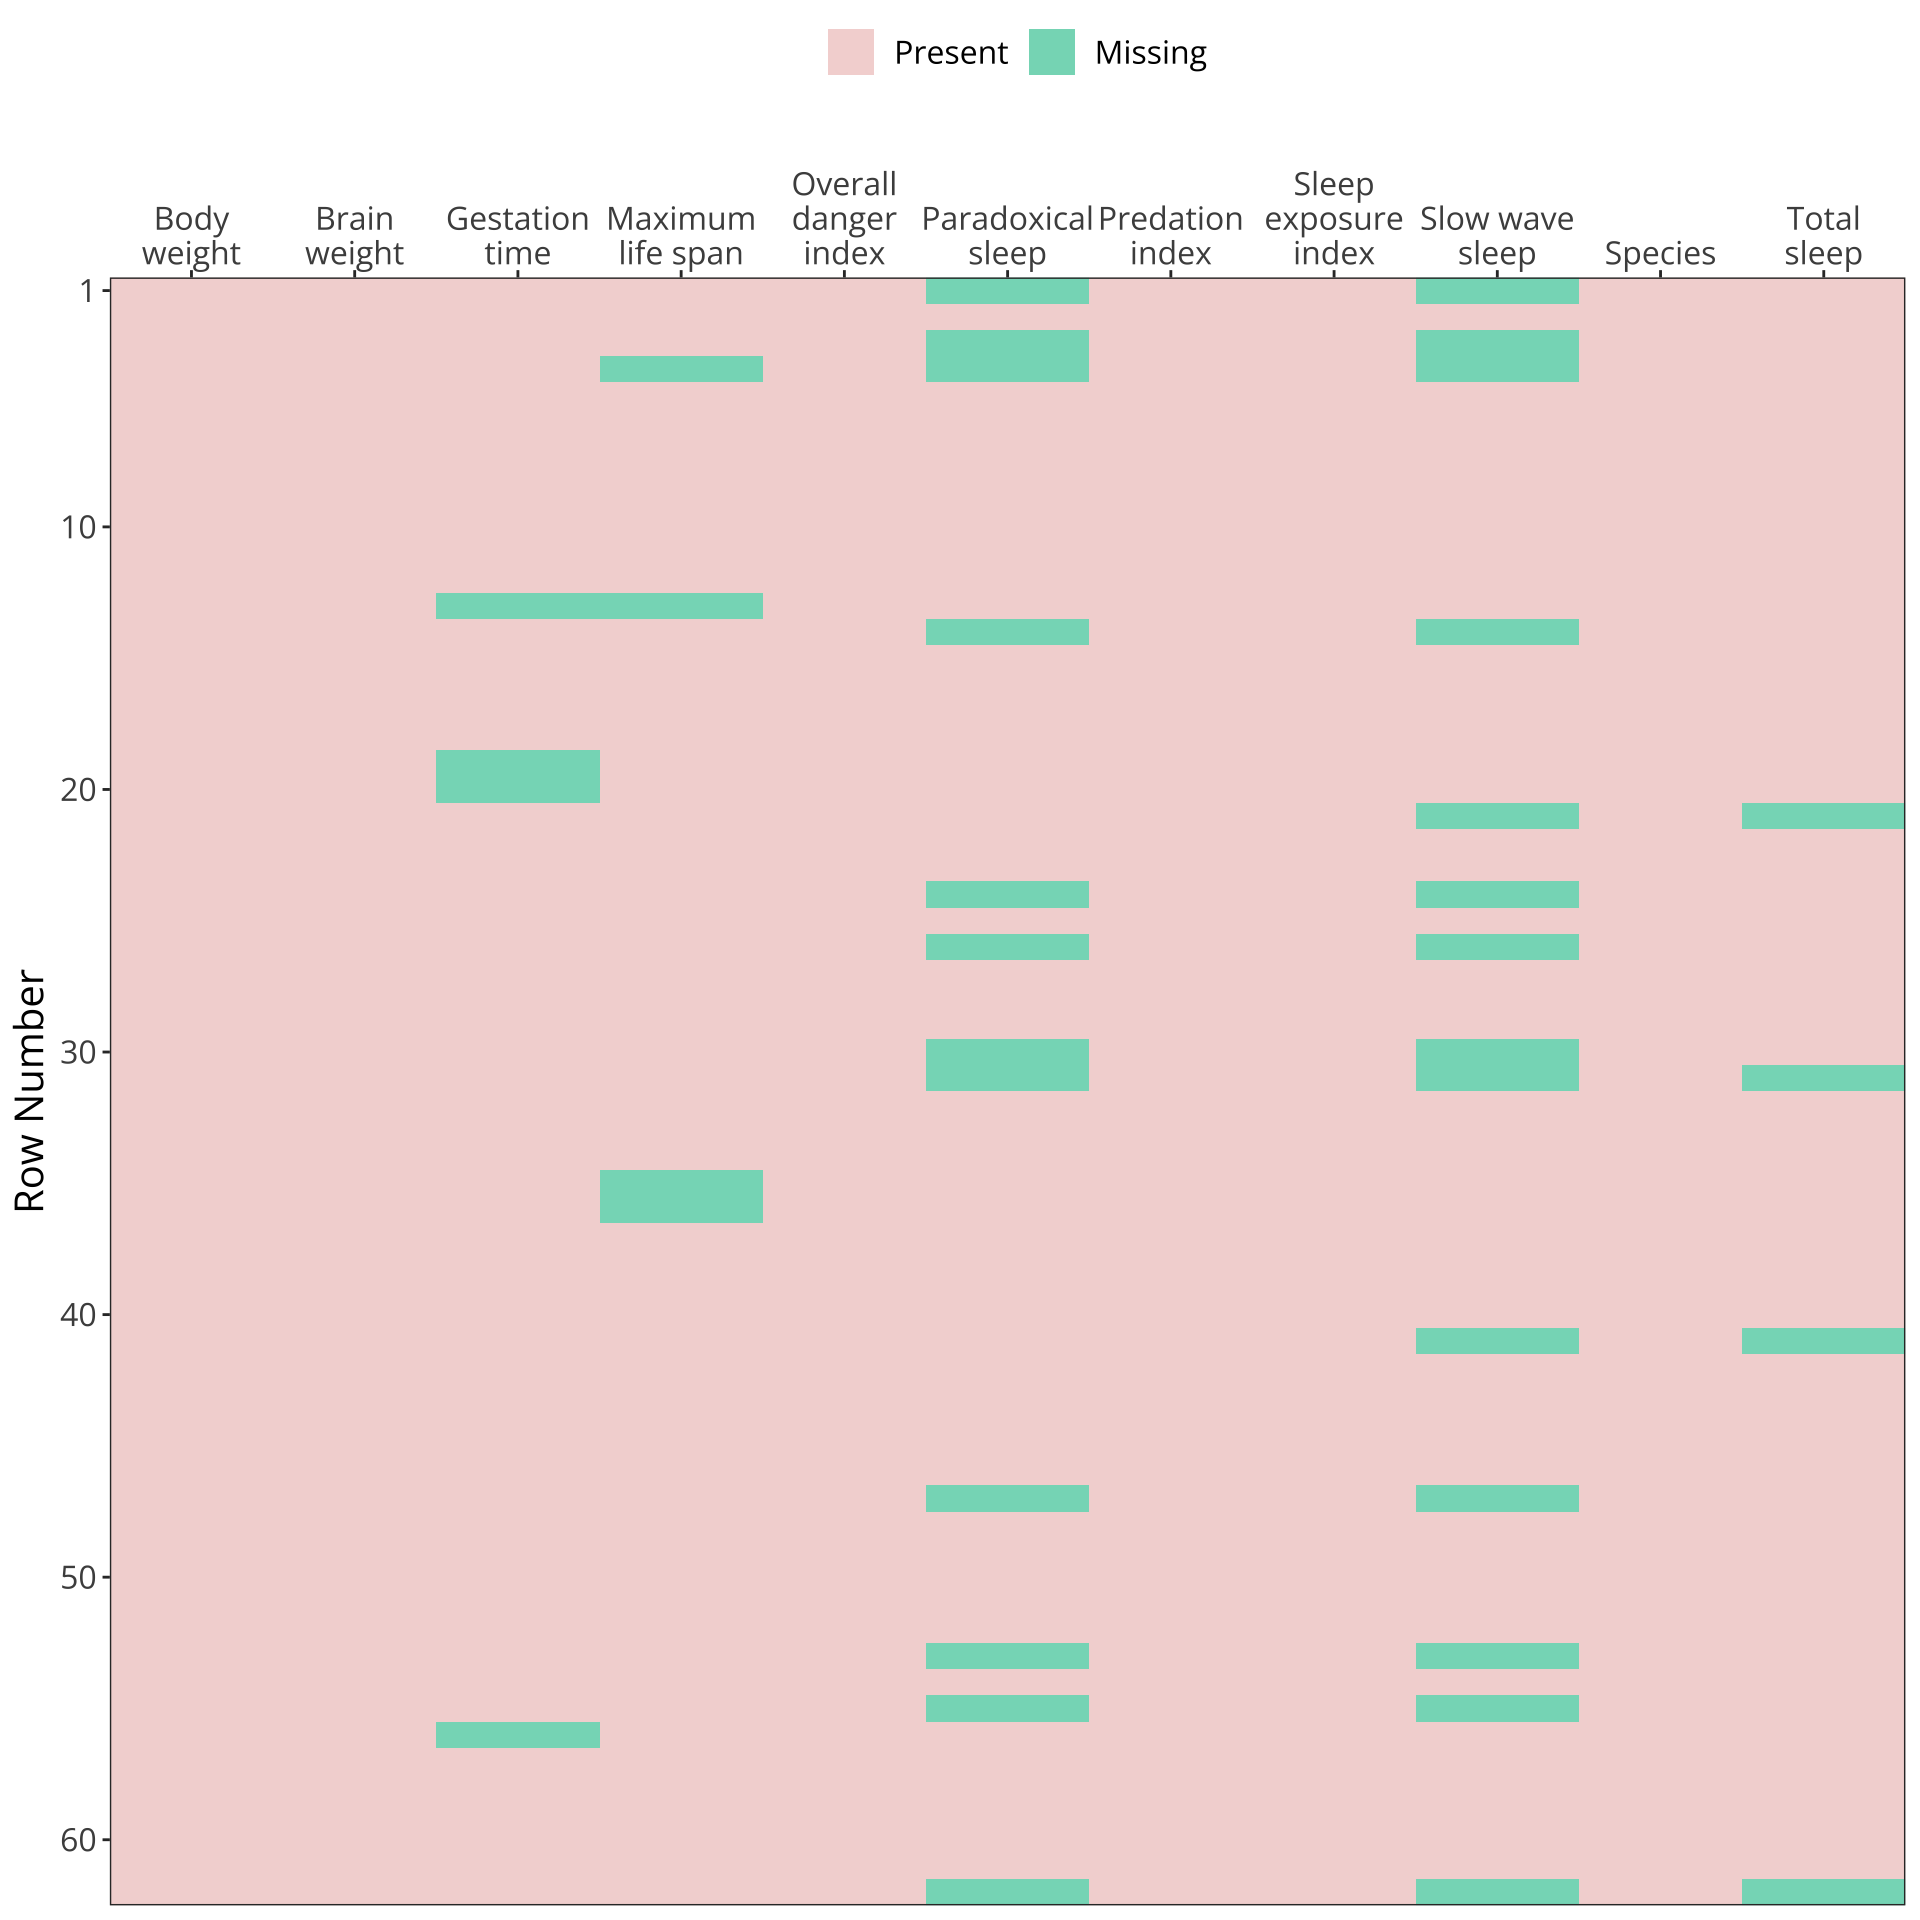
Ways of visualizing missing data
When recently looking at a data set with a lot of missing data I tried out a few different ways of quickly summarizing the missingness in the different variables. Here is a brief guide to the visualizations I found the most useful!