Plot model summary
Usage
# S3 method for class 'inlamemi'
plot(
  x,
  plot_moi = TRUE,
  plot_imp = TRUE,
  plot_mis = TRUE,
  plot_intercepts = TRUE,
  error_variable_highlight = FALSE,
  greek = FALSE,
  palette = NULL,
  ...
)
Arguments
- x
the model returned from the fit_inlamemi function.
- plot_moi
should the posterior mean for the coefficients of the model of interest be plotted? Defaults to TRUE.
- plot_imp
should the posterior mean for the coefficients of the imputation model be plotted? Defaults to TRUE.
- plot_mis
should the posterior mean for the coefficients of the missingness model be plotted? Defaults to TRUE.
- plot_intercepts
should the posterior mean for the intercept(s) be plotted? Defaults to TRUE.
- error_variable_highlight
should the coefficient(s) of the variable(s) with error be highlighted? (circled in black) Defaults to FALSE.
- greek
make the coefficient names into greek letters with the covariate name as subscript. Defaults to FALSE.
- palette
either a number (between 1 and 5), indicating the number of the color palette to be used, or a vector of the colors to be used.
- ...
other arguments
Value
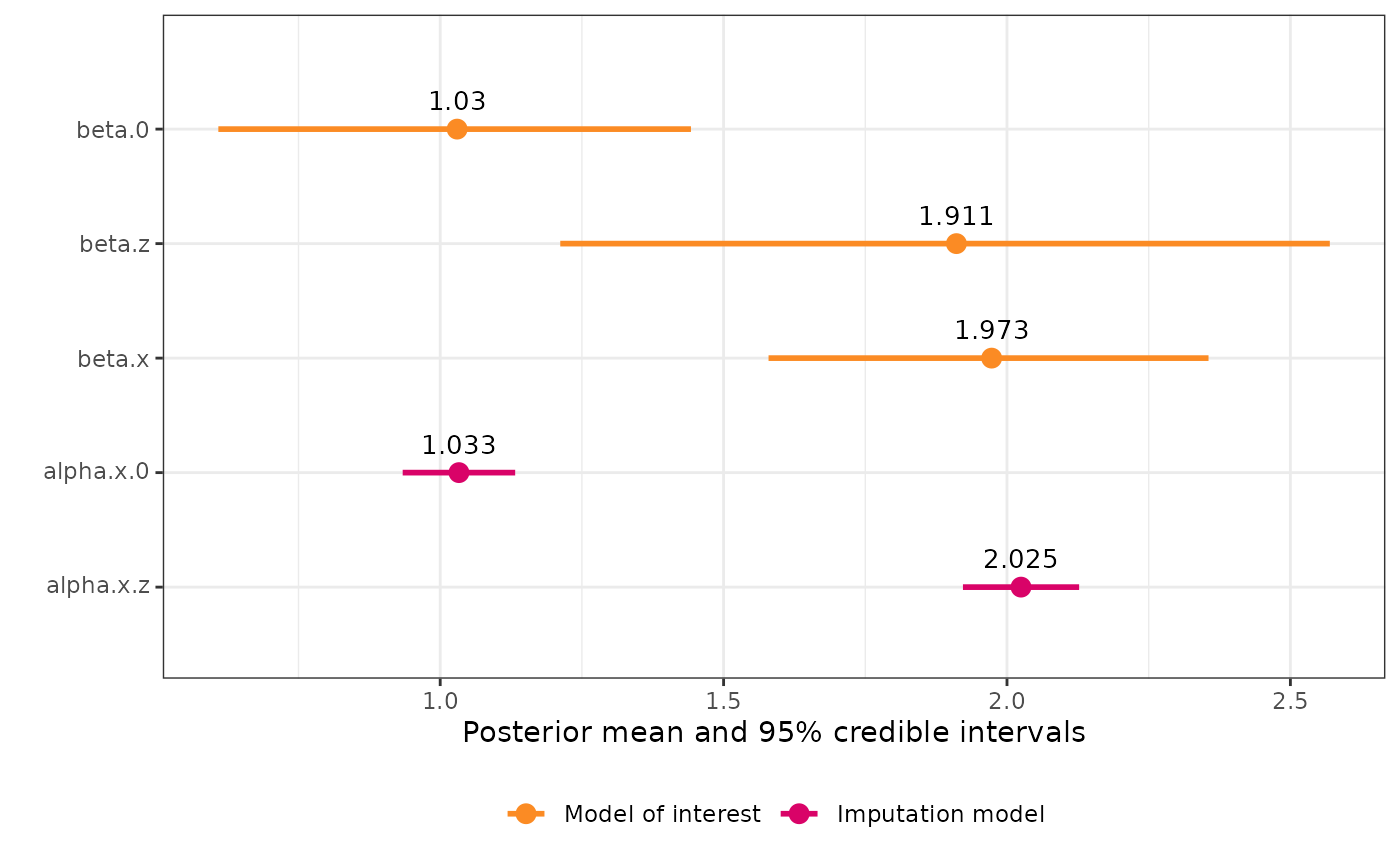
An object of class "ggplot2" that plots the posterior mean and 95 % credible interval for each coefficient in the model. The coefficients are colored to indicate if they belong to the main or imputation model, and the variable with error is also highlighted.
Examples
# Fit the model
simple_model <- fit_inlamemi(data = simple_data,
                           formula_moi = y ~ x + z,
                           formula_imp = x ~ z,
                           family_moi = "gaussian",
                           error_type = c("berkson", "classical"),
                           prior.prec.moi = c(10, 9),
                           prior.prec.berkson = c(10, 9),
                           prior.prec.classical = c(10, 9),
                           prior.prec.imp = c(10, 9),
                           prior.beta.error = c(0, 1/1000),
                           initial.prec.moi = 1,
                           initial.prec.berkson = 1,
                           initial.prec.classical = 1,
                           initial.prec.imp = 1)

plot(simple_model)
